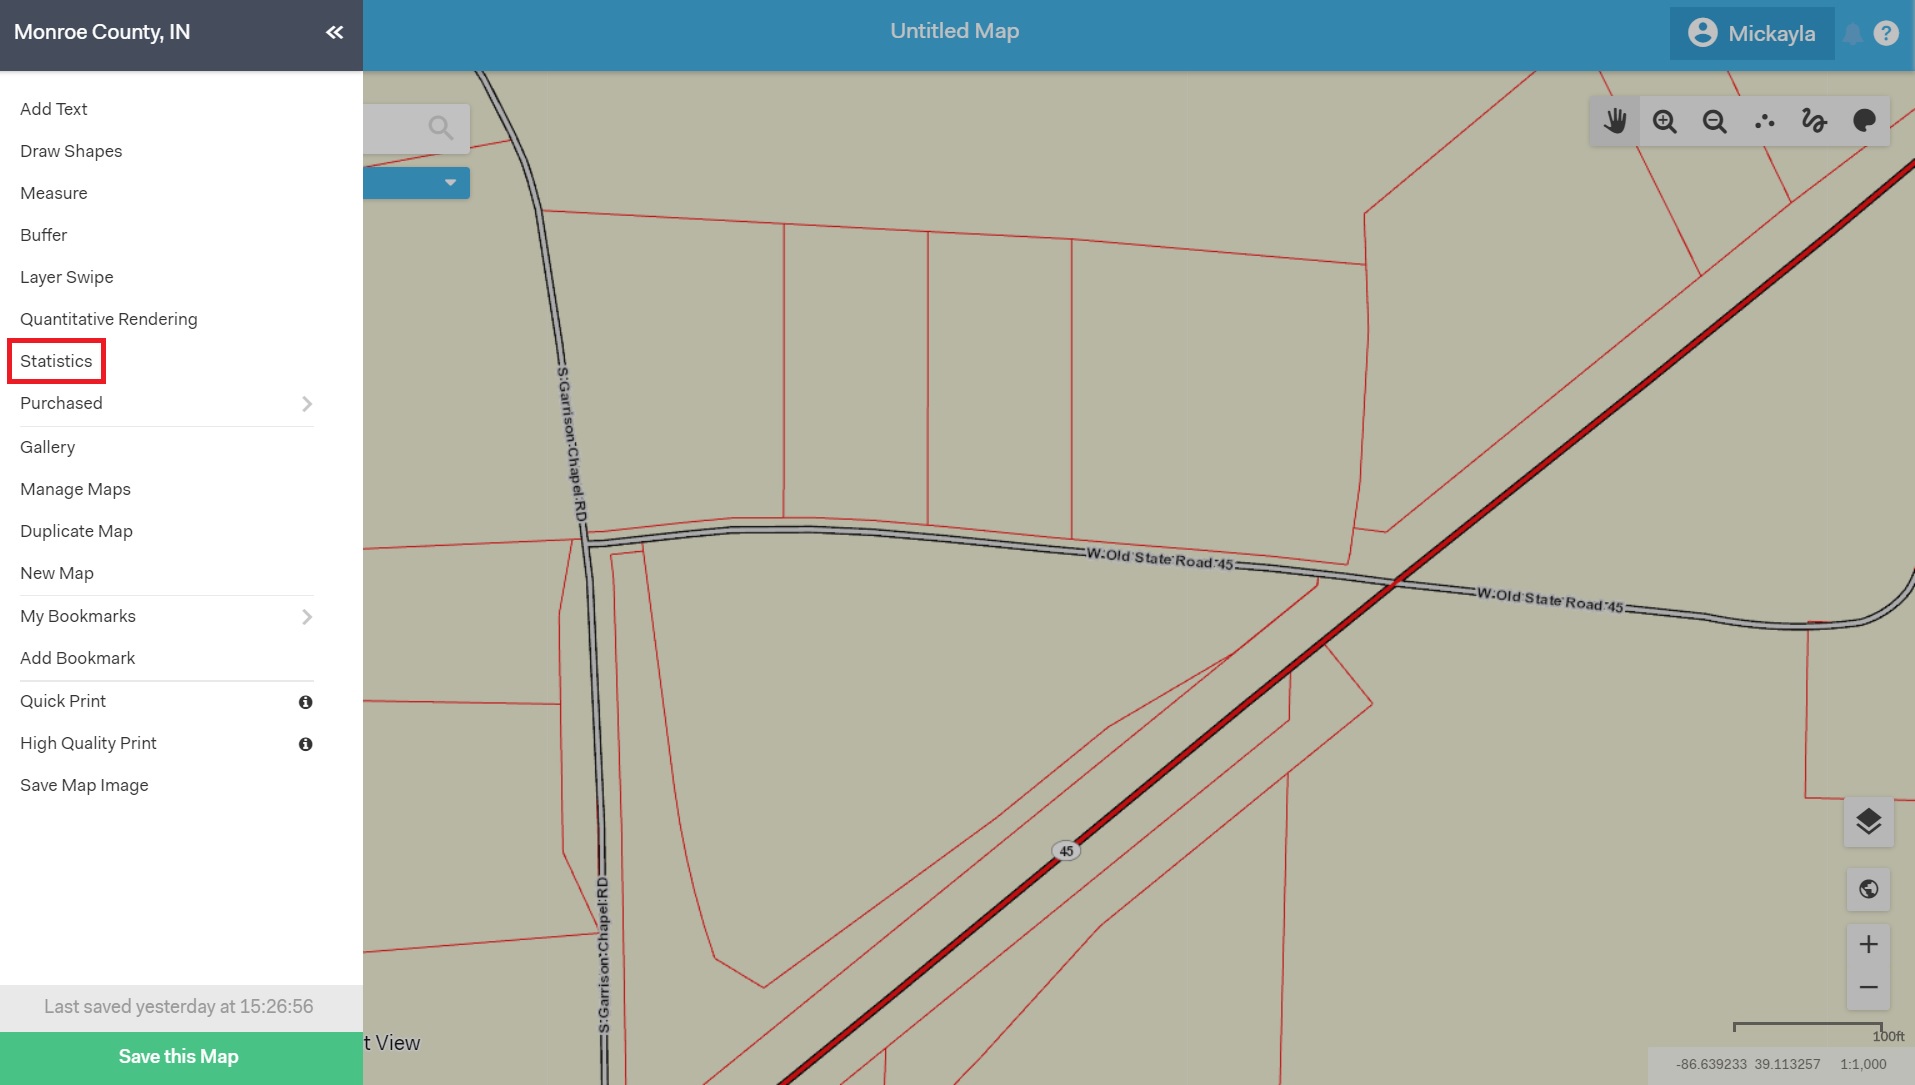
How to use the Statistics Tool
The Statistics Tool is useful to quickly visualize data within an area. It can be used for many different features, but the most common use is to see the difference of assessment values of parcels in a specific area.
Some of the fields you can view are Property Class Code, Land Value, Improvement Value, Total Assessed Value, and Legal Acreage, among others.

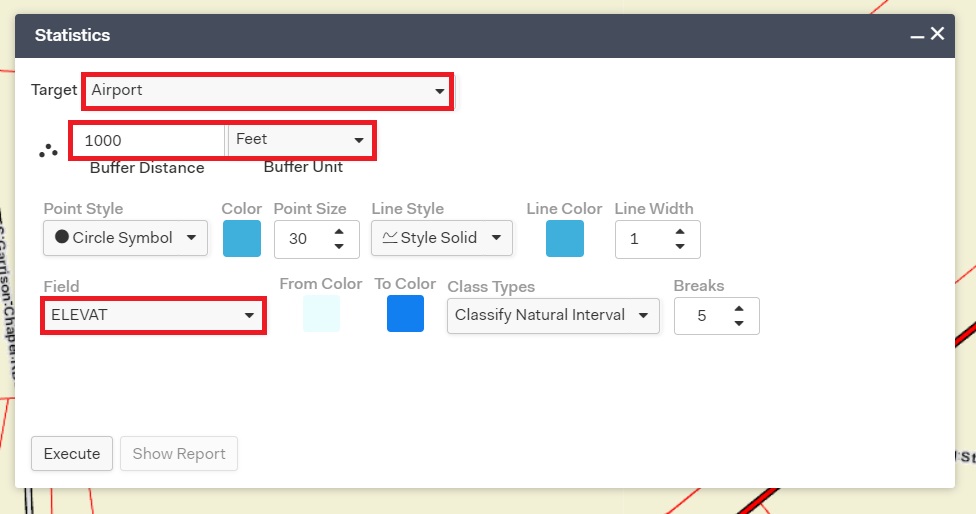
Select your feature from the Target drop-down menu. This is the feature you want to perform the statistics tool on.
Input your buffer distance and unit. This is the radius of the circle area that will be created around your selected point on the map. Only this area will be assessed using the tool.
Select what field you would like to show by selecting an option from the Field drop-down menu. This is how the parcels (or other feature) will be assessed.
Optional: Change the look of the output by changing the style drop-down selections or color selections. You can also change the type of breaks between classes and the number of classes by changing the selections in the Class Types and Breaks selection boxes.

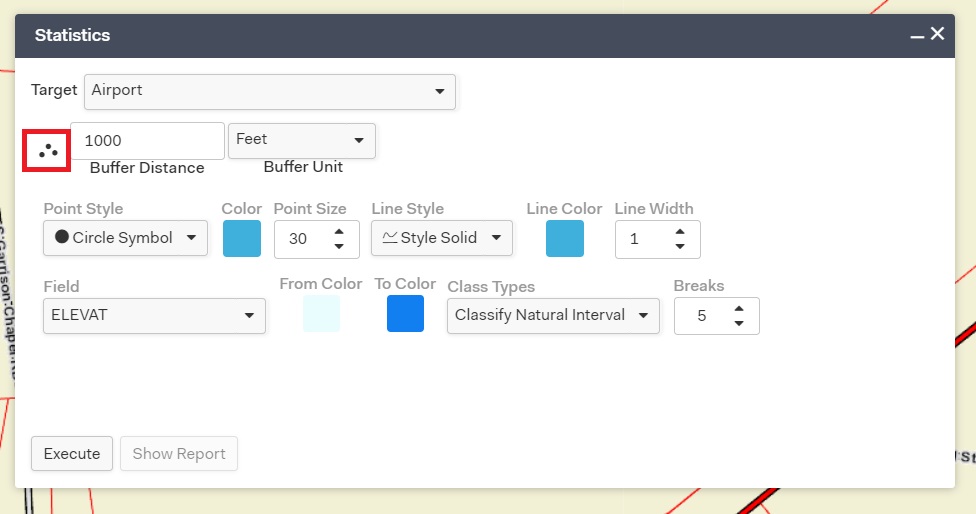
- When you are ready to run the tool, click the 3 dots in the Statistics Tool window (next to the Buffer Distance box). Then, click anywhere on the map where you would like to run the tool. This point will be the center of the tested area.

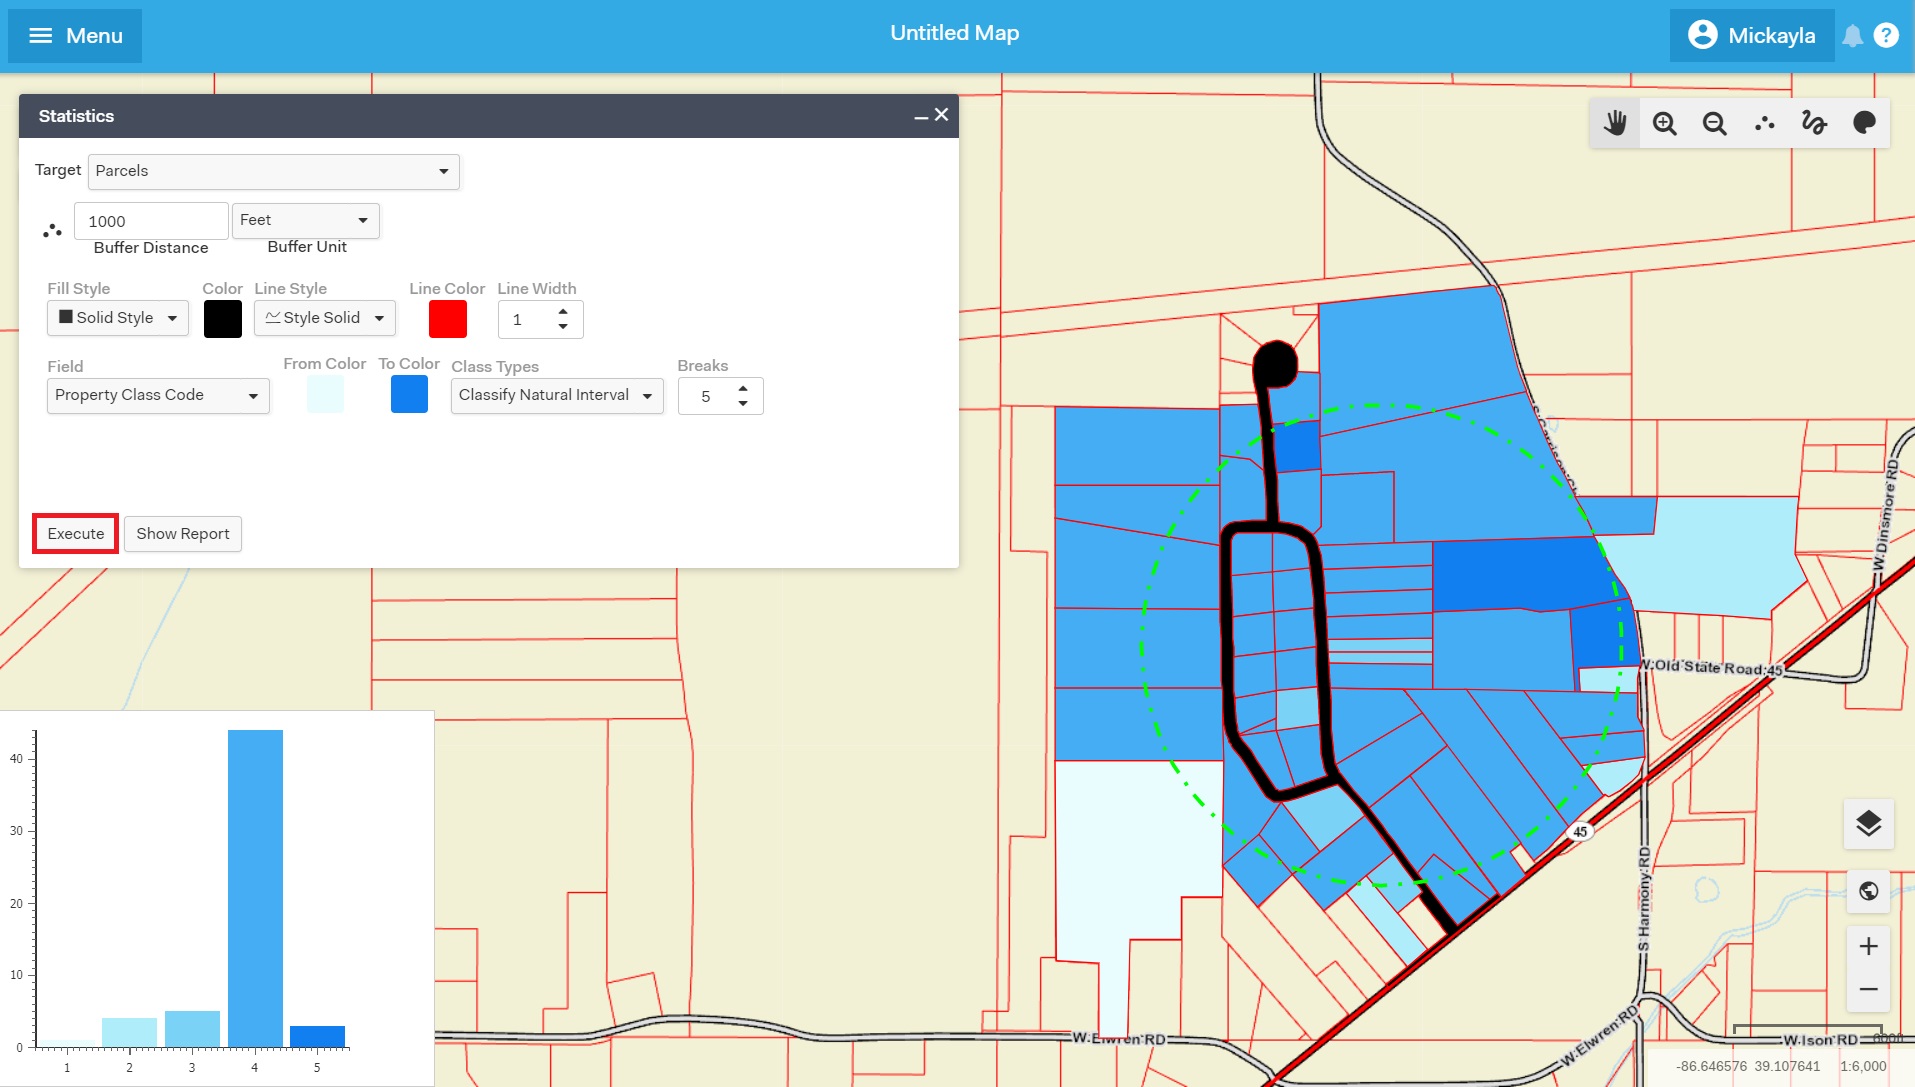
- Select "Execute" in the bottom left corner of the Statistics Tool window. The buffer testing area will be drawn around your point on the map. The parcels will change color based on your selections, and a graph will appear in the bottom left corner of the screen. You can also select "Show Report" to view and print a report of the output.

To make changes to the output, you can alter your selections in the Statistics Tool window, and click "Execute" to run the tool again.
To exit the Statistics Tool, click "X" in the top right corner of the tool window.